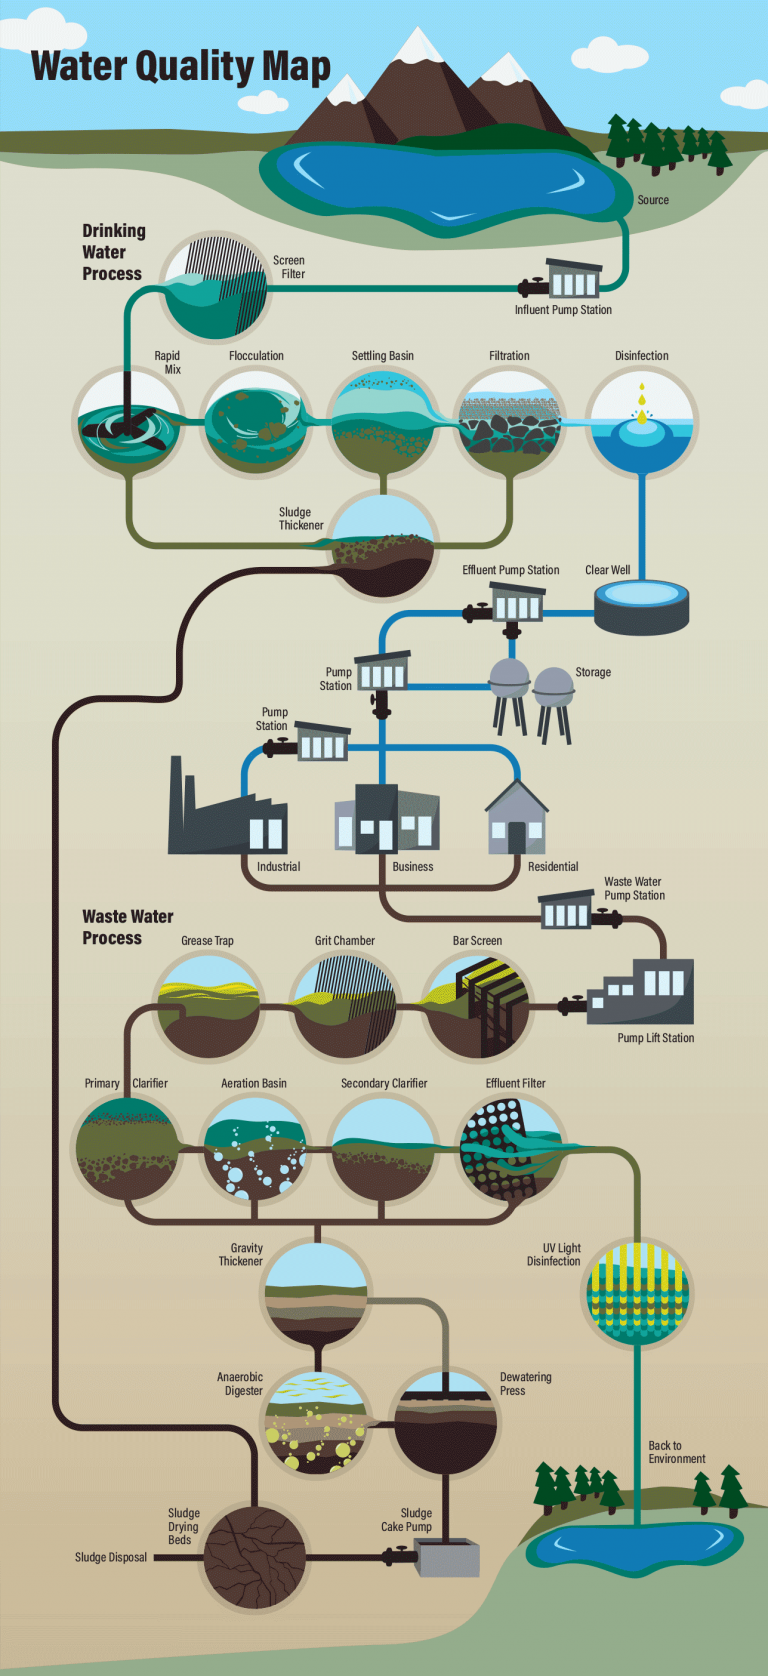
A water-quality device manufacturer needed a visual representation of the water process to help cross-functional teams understand their customers' day-to-day water process. This resource could aidR&D Engineers and UX to identify the "where" devices are needed and what water factors impact the devices being created.
My Role
100% Illustrator and UI Designer; Worked with UX Researcher
Outcome
UX Researchers have found the map aids in discussions with engineers—improving clarity, saving time, and quickly aligning team members.
UX Research Handoff
The UX researcher handed off a Miro board with the clip art and explanations of the process that connected the different phases and locations of the water process.
Rough Flow
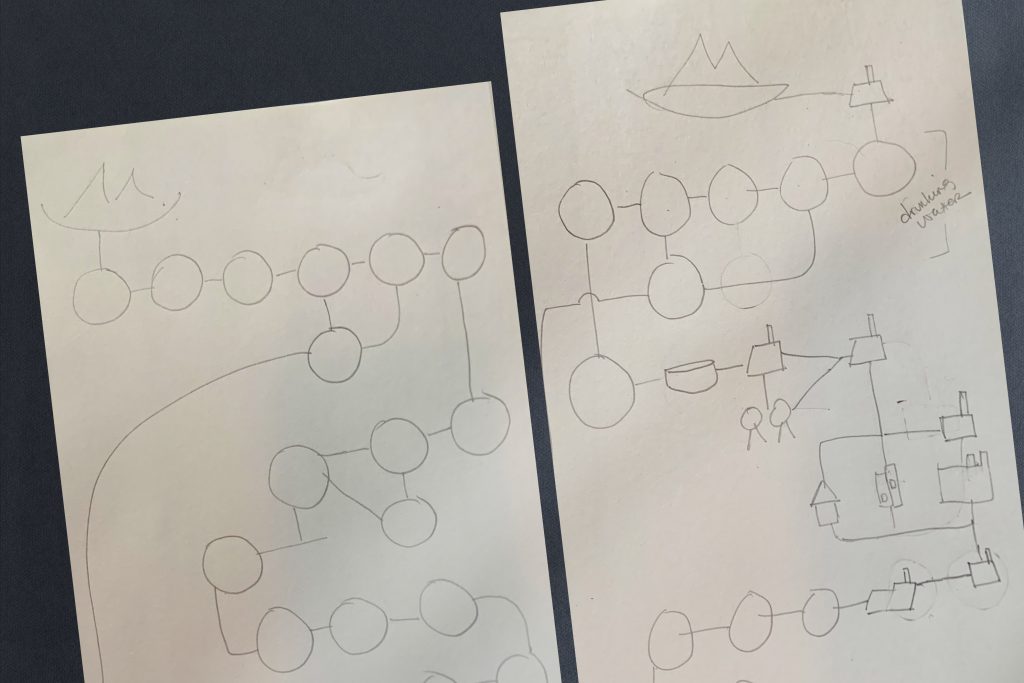
Sketches
After reading through the research, I began to sketch out the water process onto paper work out a simplified flow. After some sketching, it became clear that two types of illustrated information were required for the map: location & process (shown above, on right).
Discoveries
& Conclusions
1) The process and location imagery needed to be different 2) The water process was more important to understanding the customers 3) There are overlaps in process imagery
Visual Research
& Illustration
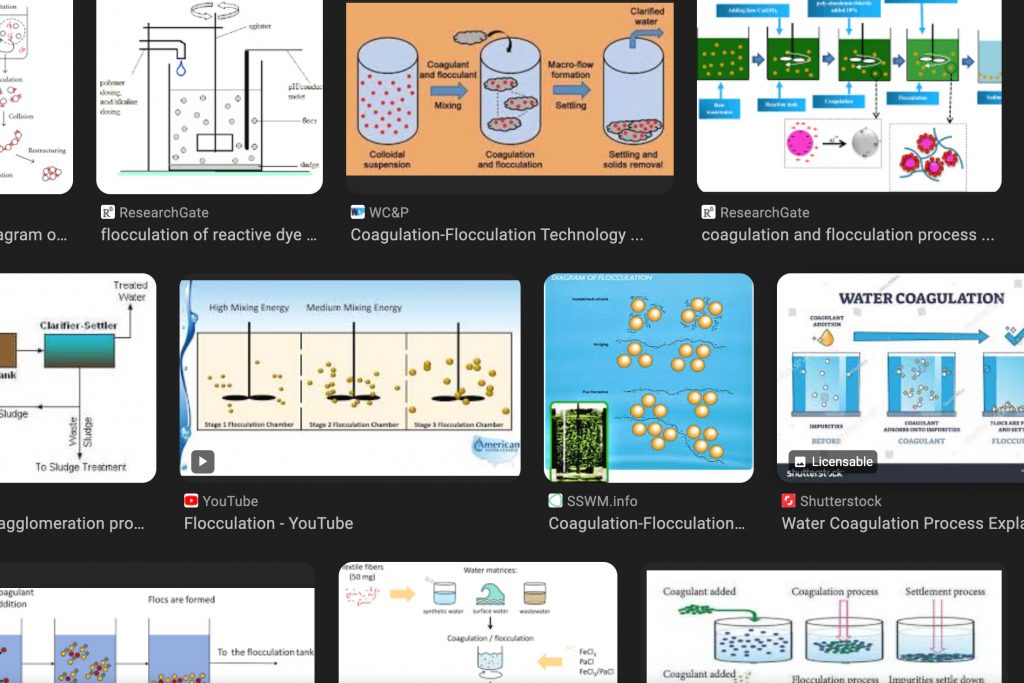
Before illustrating, I researched and collected visual examples to inform each stage of the water process. Pulling visual concepts, helped me convey what was happening in the water at each phase.
Presentation
Presentation of the map and its progress happened in 3 stages: 1) Early concept sketches—presenting to the immediate UX team for feedback on content, flow, and look/feel/style 2)Mid-way progress—presented to the UX team to insure that the project was on track and iterations were completed 3) Final presentation—presented to Head of R&D; global UX team; and local UX team members for additional feedback and ultimate launch
Outcome &
Value Added
The finished water process map made possible the following uses:
1) Environment mapping—helps product development identify where a device is needed, creating clarity and alignment, while saving time 2) Interactive learning—includes pop-ups that describe each phase of the water process, connecting cross-functional departments with a greater understanding of customer needs, enabling them to serve customers with greater empathy.